
UPS Battery Backup Time: How to Calculate What You Actually Need
The datasheet runtime is a curve, not a number—and the only honest way to size autonomy is to start from load, battery data and an end-of-life margin
Introduction
“How long will the UPS last?” is the first question every buyer asks and the one most frequently answered badly. The reason is that runtime is not a property of the UPS—it is a property of the pair formed by the load and the battery. Change the load and the same battery string delivers a different number; change the battery age and the same load gets less. A datasheet runtime figure quoted without its load condition is a marketing statement, not an engineering one.
The practical consequence is that projects get sized from the wrong end. Buyers pick a UPS kVA first, then read whichever runtime number appears next to it, and discover during commissioning that the load is heavier than assumed, the batteries are near end of life, and the actual autonomy is a fraction of the plan. The fix is not complicated, but it does require accepting three facts: runtime follows a non-linear curve, the curve degrades over the battery’s life, and the load is a moving target that must be measured rather than assumed.
This guide walks through the calculation in the order that actually works—load first, battery second, derating third—explains why datasheet curves mislead, gives the sizing method for common applications, and closes with a specification checklist. For the wider system context, our data center and critical power range covers the equipment that surrounds the battery string.
Why Runtime Is a Curve, Not a Number
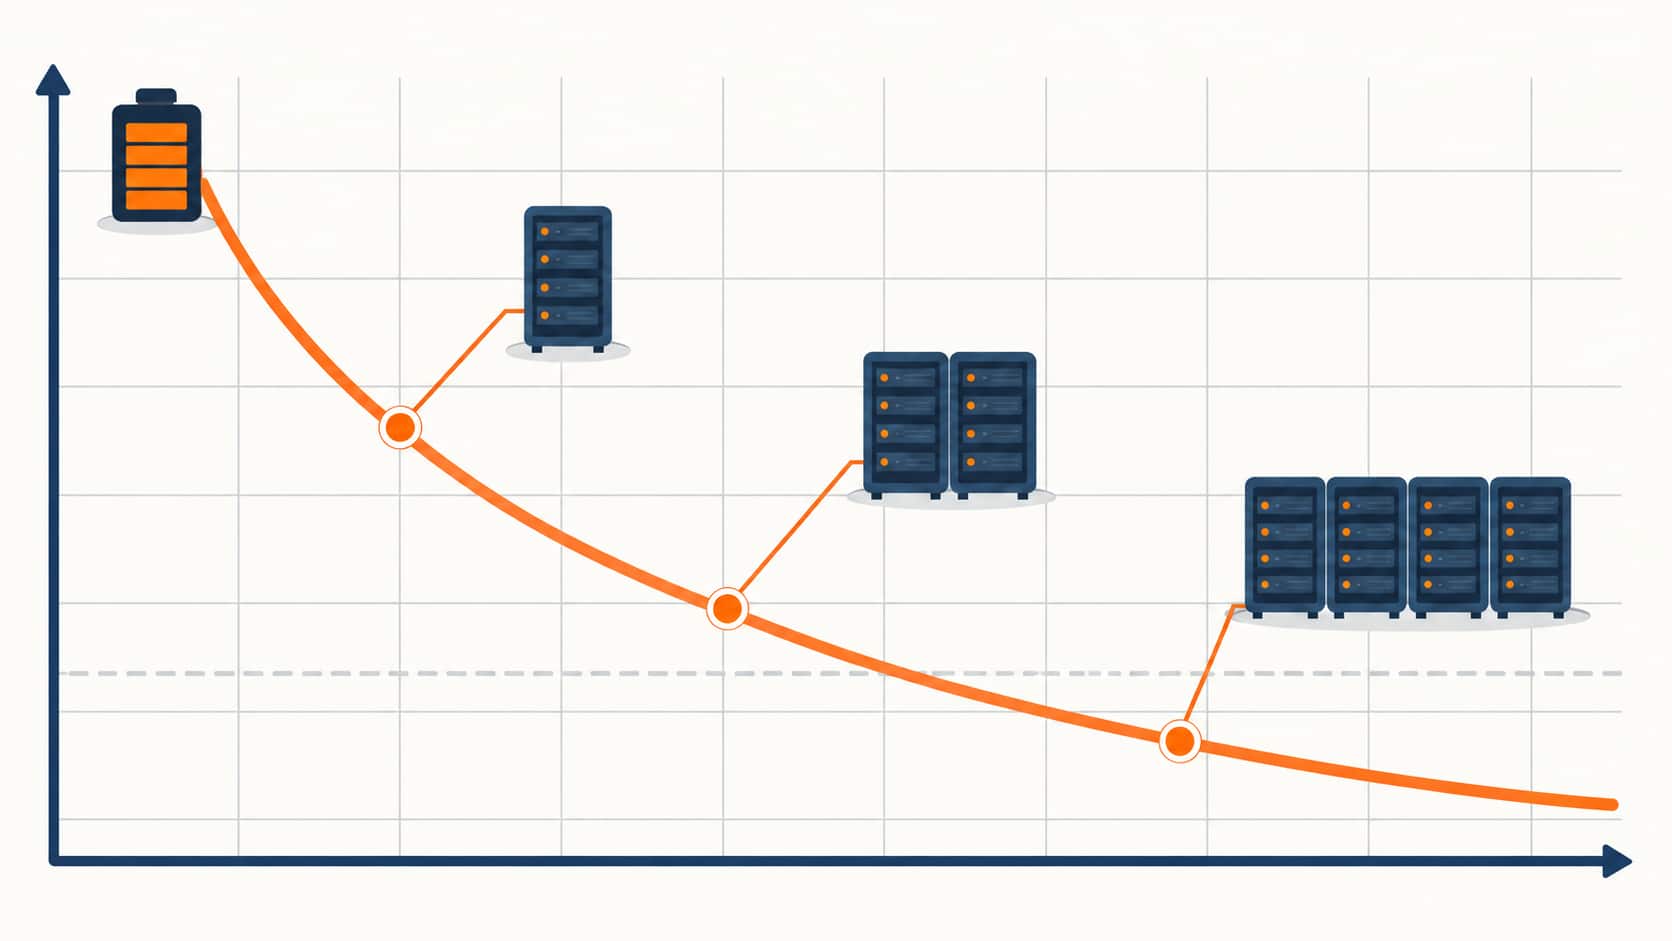
A battery stores a finite quantity of energy, and the rate at which you withdraw it determines how much of that energy is actually usable. This is the Peukert effect: discharge a lead-acid battery gently and you recover close to its rated capacity; discharge it hard and the usable capacity falls well below the label. Doubling the load does not halve the runtime—it cuts it by more than half, because the faster discharge is also less efficient.
The flip side is equally important and more encouraging: halving the load gives you considerably more than double the runtime. This non-linearity is why runtime curves on UPS datasheets slope rather than fall in a straight line, and why extrapolating from one point on the curve is unreliable. It is also why oversized UPS systems frequently deliver generous autonomy on light loads and disappointing autonomy the moment the facility fills up—the curve was always there, the load simply moved along it.
The second reason runtime is a curve rather than a number is that the battery’s capacity changes over its life. A battery delivering its rated capacity when new will deliver appreciably less after years of float service, temperature exposure and cycling. Designers therefore work with a capacity derating factor representing end-of-life performance, and a system sized to that derated figure still meets the runtime target on the day the batteries are due for replacement. Sizing to nameplate capacity means the target is missed long before the replacement date.
Step 1: Establish the Real Load
The calculation starts with kW, not kVA, and with measured data rather than nameplate arithmetic. UPS load is best expressed in kW because the battery’s energy capability maps onto real power; the power factor converts between them, and assuming a flattering power factor is one of the classic ways to overstate autonomy.
Inventory the load properly. List every device on the UPS bus with its actual operating power, not its PSU rating. Server nameplate ratings routinely exceed real draw by a wide margin, and a load schedule built from nameplates typically overstates demand severely—which is not harmless, because it leads to an oversized UPS running at a small fraction of capacity, where efficiency is poor and the battery curve is being read at the wrong point.
Measure where possible. A power meter on the existing distribution board gives a truer figure than any calculation, and in a live facility it also reveals the difference between nominal and peak demand. Where measurement is impossible, apply a documented diversity factor to the nameplate total rather than pretending the sum is real.
Plan for growth explicitly. The load on day one is never the load in year five. Agree a growth allowance with the client and size the battery bank for the grown load, or accept in writing that autonomy will shrink as the facility fills. Both are defensible; silently ignoring growth is not.
Step 2: Read the Battery Data Correctly
Battery runtime data comes in two forms and they are not interchangeable. Manufacturer discharge tables show watts per cell at a given end voltage for various discharge durations; discharge curves show the relationship graphically. Both are quoted at a reference temperature—usually 25 °C—and both assume a healthy, fully charged battery.
Working from the tables means dividing the total load by the number of cells to get watts per cell, then finding the discharge duration that matches at the specified end voltage. End voltage matters more than most buyers realize: a lower cutoff extracts more runtime but shortens battery life, and a higher cutoff protects the battery at the cost of autonomy. The end voltage must match what the UPS actually enforces, otherwise the table is being read under a condition the system will never deliver.
Temperature is the second correction. Battery capacity falls as temperature drops—figures in the region of ten percent capacity loss for every ten degrees below the reference are commonly cited—so a battery room running cold will under-deliver regardless of what the tables say. Conversely, running warm buys capacity at the cost of service life, which is a trade with a long tail: a battery kept well above reference temperature may meet its runtime target for years and then fail early and abruptly.
Step 3: Apply the Derating Factors
Between the datasheet figure and the installed reality sit several multipliers, and skipping them is the single most common cause of missed runtime targets. The table below sets out what each does to the number.
| Application | Typical Target | What Sets the Figure | Sizing Note |
|---|---|---|---|
| Bridging to a generator | A few minutes | Generator start, transfer and stabilisation time, plus margin | The workhorse caseâbuy only enough to cover the gap, not hours of autonomy |
| Ride-through of short disturbances | Seconds to 1â2 minutes | Typical utility fault-clearing and reclose duration on the local network | Small banks; verify the local network's reclose behaviour rather than assuming |
| Orderly shutdown of IT | 5â15 minutes | Time needed to flush, save and power down the protected systems | Often paired with a larger runtime target on a smaller critical subset |
| Full-load autonomy (no generator) | 30 minutes to several hours | Business decision: how long must the site keep working with no backup source | Cost scales steeply; consider whether storage or a generator serves better |
| Industrial process protection | Minutes, or the controlled-shutdown window | Process physicsâsafe stop time for the plant | Define the safe-stop sequence first, then size to it |
| Battery maintenance transitions | Minutes | Time to hand load over between redundant modules | Covered by redundancy sizing rather than by extra battery capacity |
Age derating. Design for the end of the battery’s service life, not the beginning. A bank sized to nameplate delivers its target only while new; sizing to a realistic end-of-life capacity means the target holds for the whole maintenance interval.
Temperature derating. Correct the capacity figure to the actual expected battery room temperature, using the manufacturer’s data rather than a rule of thumb where available.
Inverter efficiency and wiring losses. Energy drawn from the battery passes through conversion and cabling before it reaches the load, and the losses must be counted on the battery side of the equation.
Discharge-rate correction. Because of the Peukert effect, the watts-per-cell figure at your target duration is not the same as the figure at a nominal duration—read the table at the right row.
Design margin. A margin on top of the derated figure covers manufacturing spread, partial aging and the difference between laboratory and site conditions. Its size should be a documented decision, not an arbitrary habit.
Runtime Targets by Application
The right autonomy figure depends entirely on what the UPS is bridging to. Sizing for “the longest we can afford” produces expensive banks that spend their life shallow-cycling for no benefit; sizing for the actual bridge produces a smaller, better-maintained system.
| Factor | What It Does to Runtime | How to Handle It | Consequence If Ignored |
|---|---|---|---|
| Age (end of life) | Reduces usable capacity as the bank ages toward replacement | Sizing to a documented end-of-life capacity factor, not nameplate | Target met in year one, missed well before replacement |
| Temperature | Cuts capacity below the reference; cold rooms lose most | Correct with the maker's temperature data for the actual room | Under-delivery on the coldest day, exactly when margin is wanted |
| Discharge rate | Higher load draws usable capacity down faster than linearly | Read the discharge table at the target duration row, not a nominal one | Runtime overstated whenever the load is heavier than assumed |
| Inverter and wiring losses | Consumes energy between battery and load | Count losses on the battery side of the calculation | A systematic shortfall on every discharge event |
| End voltage setting | Sets how deeply the battery is allowed to discharge | Match the discharge table to the cutoff the UPS enforces | A duration the system will never actually deliver |
| Design margin | Absorbs spread between lab and site conditions | Set a documented margin rather than a habit | No protection against the many small unquantified losses |
Lead-Acid, Lithium and What Changes
The calculation method is common to both chemistries, but the numbers behave differently. Valve-regulated lead-acid remains the default for its low upfront cost, wide availability and predictable recycling, but it is heavier for a given capacity, more sensitive to temperature, and its capacity decline accelerates toward the end of life—which is precisely why the end-of-life derating factor matters so much. Lithium iron phosphate banks offer more usable capacity per unit of volume and weight, flatter voltage across discharge, tolerance of higher discharge rates without the same capacity penalty, and typically longer service life with better monitoring. The trade is higher upfront cost and additional battery management electronics.
For runtime sizing the practical difference is that lithium’s flatter discharge curve and lower rate-related capacity loss mean the derating stack is smaller, so a lithium bank can be specified closer to its nominal figure than an equivalent lead-acid bank. That does not remove the need for derating—it changes the coefficients. Detailed chemistry comparison and cycle-life economics belong in our overview of what a battery energy storage system is, which covers the storage side of the same question.
When More Runtime Is the Wrong Answer
A longer runtime is not automatically a better system, and several common briefs are better served another way. If the underlying goal is surviving multi-hour outages, batteries are an expensive way to buy duration—a generator, or a hybrid generator-and-storage arrangement, delivers hours at a fraction of the cost per kWh, and the UPS’s job returns to bridging the transfer. If the goal is lowering energy costs or shaving peaks, that is energy management rather than power protection, and the correct equipment is a storage system sized on economics, not a UPS with an oversized battery bank.
Likewise, chasing runtime to compensate for a marginal upstream supply is treating a symptom. Where the grid is chronically unreliable, the honest architecture addresses the supply first—the bridging role is then small and cheap. Our discussion of generator and storage hybrid systems sets out where battery duration genuinely earns its cost and where it does not. Where the site already runs a storage system for peak shaving, the same bank can often serve a short bridging duty as well—see our guide to sizing battery storage for peak shaving for how that capacity is normally calculated.
The final case is the most common of all: buying a large battery bank to cover a load that was never measured. If the load schedule was built from nameplates, half the autonomy paid for may never be needed. Measuring first is the cheapest runtime improvement available.
Common Calculation Mistakes
Reading a datasheet runtime figure as if it applied at the site’s actual load. Sizing in kVA while the battery data is in kW and quietly assuming a favourable power factor. Using a nameplate load schedule with no diversity factor, then designing a bank that never gets exercised. Ignoring end-of-life derating, so the system meets its target in year one and misses it from year four. Forgetting temperature: a cold battery room can lose a tenth of capacity per ten degrees of deviation, and a hot one trades life for capacity. Reading the discharge table at the wrong end voltage, which produces a duration the UPS will never actually deliver. And the structural error of sizing the battery before the load and the bridge requirement are agreed—which guarantees rework, because both of those figures move during design.
Specification Checklist
Use these points to make competing quotations comparable:
- Load basis: measured or diversified kW at stated power factor, plus the agreed growth allowance and the load condition at which runtime is quoted.
- Runtime target: the bridge requirement in minutes, justified by generator start time, safe-stop window or business decision—not a round number chosen for comfort.
- Battery data: chemistry, capacity at the specified end voltage, discharge table referenced to the target duration, and the reference temperature used.
- Derating: end-of-life capacity factor, temperature correction, inverter efficiency, wiring losses, and the stated design margin.
- Monitoring: string and block-level voltage and impedance or conductance monitoring, with alarm thresholds and reporting.
- Service: expected design life at the site’s temperature, replacement interval, and whether the runtime guarantee applies at end of life or only when new.
Conclusion
UPS battery backup time is an output, not a specification. It emerges from the load the system actually carries, the battery data read at the right duration and end voltage, and the derating factors that carry the figure from a laboratory to a battery room. Do those three steps in order and the runtime is predictable and defensible; skip them and the number on the datasheet becomes a promise nobody can keep.
The most valuable habit in the whole exercise is to agree the bridge requirement before choosing any hardware. Once the facility knows whether it is buying three minutes to cover a generator start or four hours of genuine autonomy, the equipment choice narrows sharply—and often turns out to be smaller and cheaper than the original instinct. KXY E-Power Group supplies UPS systems and battery banks sized from load data and bridge requirements rather than from a catalogue page; send us your load schedule and target autonomy and we will propose the bank that meets it at end of life, not just on day one.
Frequently Asked Questions
Recent Posts
Voltage Stabilizers vs UPS: Do You Need Both?
Voltage Stabilizers vs UPS: Do You Need Both? One device fixes how high or low the voltage is; the other fixes whether there is voltage

Energy Storage for Data Centers: A Growing Backup Power Option
Energy Storage for Data Centers: A Growing Backup Power Option Batteries have always backed up data centers in the form of UPS strings. Grid-scale BESS
Thermal Runaway in Lithium Batteries: What BESS Buyers Should Understand
Thermal Runaway in Lithium Batteries: What BESS Buyers Should Understand How thermal runaway starts, how it propagates, and which evidence buyers should require before approving