
How to Size a Battery Energy Storage System for Peak Shaving
Use interval demand data, tariff rules, dispatch simulation, efficiency, SOC limits, and degradation to estimate the PCS power and usable battery capacity your site actually needs.
What Peak Shaving Actually Solves
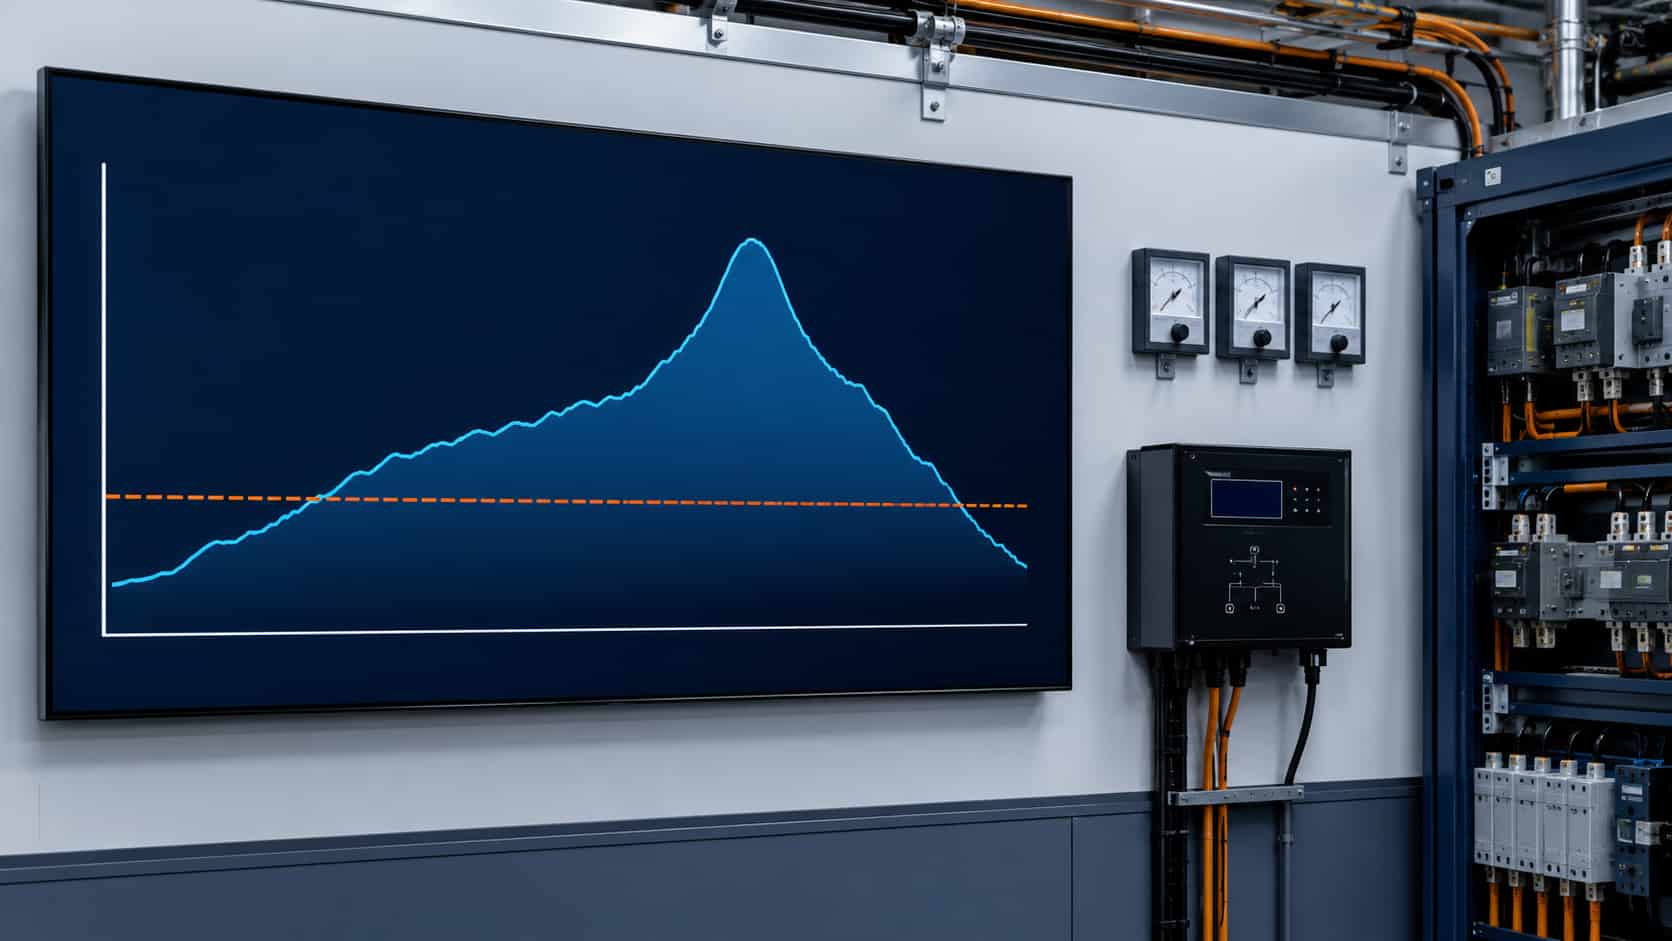
Many commercial and industrial electricity bills include a demand charge based on the highest average power recorded during a defined interval in the billing period. A battery energy storage system can discharge when facility demand approaches a control threshold, limiting the power imported from the grid.
Peak shaving is not identical to time-of-use energy arbitrage. Arbitrage responds mainly to energy prices across time; peak shaving controls the maximum metered demand. One unsuccessful peak can set the demand charge for the period, so forecasting and retained state of charge can matter as much as nominal battery capacity.
Before sizing equipment, confirm exactly how the tariff measures demand. Utilities may use 15-, 30-, or 60-minute intervals; rolling or fixed windows; on-peak-only demand; ratchets based on previous months; seasonal rates; coincident peaks; or separate charges for different time periods.
Step 1: Collect Interval Load and Operating Data
Use utility interval data or a revenue-grade site meter at a resolution at least as fine as the billing demand interval. A full year is a practical minimum for identifying seasonal behavior; more history is valuable when production, weather, or occupancy varies substantially.
Collect timestamps, grid import, solar generation, major equipment schedules, shutdowns, abnormal events, tariff calendars, billing demand values, power factor, generator operation, and planned load growth. Check missing intervals, time-zone changes, meter multipliers, and whether data represents kW demand or interval energy that must be converted.
Average monthly bills alone cannot show whether a peak lasted five minutes or four hours. Those two shapes can have the same billed maximum but require very different battery power, energy, and control strategies.
Step 2: Reproduce the Utility Bill
Before simulating a battery, calculate historical billed demand from the interval data and compare it with actual invoices. This validates the meter boundary, interval aggregation, tariff periods, ratchets, and adjustments.
If the calculated bill does not match the utility bill, do not continue with sizing assumptions. Resolve whether the issue is interval alignment, missing data, reactive demand, a different meter, taxes, contract demand, or another tariff rule. Financial savings depend on the bill calculation, not only the load curve.
Step 3: Select a Candidate Demand Limit
Choose a grid-import threshold below the historical peak. The instantaneous battery command can be approximated as the facility load minus the target grid demand, subject to PCS power, battery energy, SOC, and operating limits.
Do not automatically target the lowest possible threshold. Each additional kilowatt of reduction can require disproportionate energy when the threshold cuts deeper into a broad load plateau. Test multiple thresholds and compare annual bill savings, required equipment, cycle throughput, and missed-peak risk.
Step 4: Estimate Required PCS Power
The first-pass discharge power is the maximum difference between the site load and target grid demand during the applicable billing windows. Add only justified allowance for control response, forecast error, load growth, auxiliary loads, reactive-power duty, and measurement location.
Verify whether the PCS rating is continuous AC power at the project voltage and temperature. Check overload duration, altitude and temperature derating, power-factor effects, transformer losses, grid-code requirements, and whether solar or other resources share the point-of-connection limit.
Very short load spikes may be averaged down by the billing interval, but the control system still needs adequate metering and response. Model the utility’s actual interval calculation rather than sizing from a one-second SCADA maximum.
Step 5: Calculate the Energy Above the Target
Energy is the area between the facility load curve and the target demand line while shaving is required. For interval data, calculate the positive difference for each interval, multiply by interval duration, and sum it across each continuous event.
A simple rectangular estimate—shave kW multiplied by peak duration—can be useful for screening but often overstates triangular peaks or understates irregular and repeated peaks. Use interval-by-interval integration for procurement sizing.
The largest single event is not always sufficient. A day can contain several peaks with too little time to recharge between them. Simulate consecutive events, charger power, import limits, tariff windows, and the permitted charging schedule.
Step 6: Convert Delivered AC Energy into Installed Capacity
The battery must supply more energy than the AC load receives because usable SOC range, conversion losses, transformer losses, auxiliaries, temperature limits, and degradation reduce available output. Keep each factor separate so the calculation can be audited.
A screening equation is: installed nominal energy equals required AC shaving energy divided by the product of usable SOC fraction, discharge-path efficiency, and end-of-life capacity retention. If the project must retain backup reserve, subtract that unavailable SOC before calculating the usable fraction.
Example: an event requires 300 kWh at the AC connection. If 80% of nominal energy is available for peak shaving, discharge-path efficiency is 92%, and the end-of-life capacity factor is 80%, the screening result is about 510 kWh nominal: 300 ÷ (0.80 × 0.92 × 0.80). This is an illustration, not a recommendation; supplier definitions and simulation boundaries must match.
Step 7: Model SOC, Charging, and Forecast Error
A peak-shaving controller must decide when a rising load is a genuine billing peak. Discharging too early can empty the battery before the highest interval; waiting too long can allow a new billing peak. Forecast-based controls can use production schedules, weather, solar output, historical patterns, and real-time load.
Simulate the initial SOC, minimum SOC, backup reserve, charge window, charger power, electricity price, maximum grid import during charging, weekend behavior, solar charging, and recovery before the next event. Include days with consecutive peaks and unexpected operations.
Use a conservative fallback mode for lost communications, bad meter data, PCS faults, and forecast error. The financial model should report how often the target is missed, not assume perfect dispatch.
Step 8: Include Degradation and Augmentation
Capacity fades with calendar time and energy throughput. Power capability may also change with temperature, SOC, and age. Model performance across the contract life using the proposed cell, duty cycle, thermal conditions, and warranty limits.
There are two common strategies: install enough capacity on day one to meet the target near end of life, or start smaller and add modules later. Oversizing increases initial capital; augmentation introduces compatibility, space, downtime, procurement, and warranty risk.
Confirm whether the guaranteed energy is DC or AC, beginning-of-life or end-of-life, and at what temperature, C-rate, SOC window, and auxiliary-load boundary. Our battery chemistry comparison explains why chemistry names alone do not determine lifetime.
Step 9: Validate the Duty Cycle and Electrical System
Peak shaving can require daily or multiple daily cycles. Calculate annual energy throughput, equivalent full cycles, maximum continuous discharge, charge duration, dwell at high SOC, and seasonal changes. Confirm that the battery warranty and PCS thermal design cover this duty.
Then validate transformer and switchgear ratings, fault levels, protection coordination, metering location, harmonic limits, communications, interconnection rules, export prevention, grounding, auxiliary supply, and installation environment. Battery sizing does not replace an electrical study.
Worked Screening Example
Consider a facility with a verified 1,200 kW billing peak and a candidate grid-demand target of 900 kW. The maximum required shave is therefore 300 kW. Interval integration shows that the worst continuous event requires 360 kWh of AC discharge, including its irregular shape.
Assume for screening that 80% of nominal capacity is available for peak shaving after maintaining SOC limits and reserve, discharge-path efficiency is 92%, and end-of-life retained capacity is 80%. The nominal energy estimate is 360 ÷ (0.80 × 0.92 × 0.80), or approximately 611 kWh.
The starting equipment envelope might therefore be evaluated around at least 300 kW AC and approximately 611 kWh nominal, before allowances for control margin, environmental derating, reactive-power operation, auxiliary boundaries, future loads, and supplier rating increments. A full-year dispatch simulation must confirm target-hit rate, charging opportunity, throughput, savings, and warranty compliance.
| Input or result | Calculation | Example |
|---|---|---|
| Verified billing peak | Reproduced from interval data using the tariff demand window | 1,200 kW |
| Candidate grid-demand target | Selected threshold for scenario testing | 900 kW |
| Minimum PCS discharge power | Peak − target, before justified margins and derating | 300 kW |
| Required AC shaving energy | Sum of positive load-minus-target differences × interval duration | 360 kWh |
| Usable SOC fraction | Share of nominal capacity allocated to peak shaving | 80% |
| Discharge-path efficiency | Battery-to-AC boundary used in the model | 92% |
| End-of-life capacity factor | Guaranteed retained capacity used for sizing | 80% |
| Screening nominal energy | 360 ÷ (0.80 × 0.92 × 0.80) | ≈ 611 kWh |
Illustrative screening example only—not a final equipment recommendation. Confirm tariff logic, full-year dispatch, charging opportunity, backup reserve, environmental derating, auxiliary-load boundary, warranty duty and supplier rating increments.
Use Economics to Select the Final Size
Run several PCS and battery sizes rather than optimizing one technical target. For each option, calculate demand-charge savings, energy cost for charging, round-trip losses, degradation, maintenance, augmentation, financing, taxes, incentives where applicable, and residual value.
Larger systems may shave more, but marginal savings often decline. The economically preferred size can be smaller than the technically maximum reduction. It can also change if backup power, solar self-consumption, demand response, or grid services share the asset. Avoid double-counting revenue when two services need the same SOC or power at the same time.
Information to Send with an RFQ
Provide at least 12 months of interval load data, sample utility bills, the complete tariff, site single-line diagram, meter and point-of-connection details, voltage and frequency, solar and generator data, critical-load reserve, installation environment, operating schedule, planned expansion, and target project life.
Ask bidders to return PCS continuous and overload ratings, nominal and usable energy at defined boundaries, degradation curves, auxiliary consumption, efficiency maps, thermal derating, dispatch assumptions, annual throughput, achieved demand limit, missed-peak frequency, warranty conditions, and augmentation plan.
Require the supplier model to be rerun using the same inputs and tariff logic as other bidders. Otherwise, apparently similar savings estimates may be based on incompatible assumptions.
Where Kexingyu Power Fits In
Kexingyu Power can discuss BESS, PCS, switchgear, transformers, controls, and project-specific integration for commercial peak-shaving applications. Final sizing requires validated interval data, tariff rules, electrical studies, site conditions, and an agreed control strategy.
Share the raw time-series data rather than screenshots of monthly peaks. A traceable model makes it possible to distinguish required PCS power from battery energy and to evaluate equipment against the same duty cycle.
Final Takeaway
Peak-shaving sizing is a time-series and tariff problem—not simply peak kW multiplied by an estimated duration. PCS power must cover the required reduction, while usable energy must cover the integrated area above the demand target across real events.
Validate the bill, simulate full-year dispatch, retain realistic SOC and efficiency limits, account for degradation, and measure missed peaks. That turns a rough equipment estimate into a defensible procurement specification.
Frequently Asked Questions
Practical questions about peak-shaving BESS sizing.
Use at least one full year of interval data at a resolution equal to or finer than the utility demand interval. More history is useful when weather, production, occupancy or tariffs vary significantly.
As a first pass, PCS discharge power is the maximum positive difference between facility demand and the target grid-demand limit. Then verify response, continuous rating, temperature and altitude derating, power factor, losses and forecast margin.
Integrate the load above the target demand line across each event. Then account separately for usable SOC range, discharge-path efficiency, retained backup reserve, environmental limits and end-of-life capacity.
Real peaks are rarely perfect rectangles. The shortcut may overstate a triangular peak, understate irregular plateaus, or miss multiple events with insufficient recharge time. Interval-by-interval simulation is more reliable.
The design must meet the contractual objective at the agreed performance point. Buyers can oversize initially or plan augmentation, but the model and warranty must state retained energy, throughput, conditions and timing.
Yes, but both services compete for SOC and sometimes PCS power. Reserve energy for backup in the dispatch model and avoid counting the same capacity as fully available for both services simultaneously.
Request achieved demand limit, missed-peak rate, PCS and energy ratings, model boundary, efficiency, auxiliaries, degradation, throughput, charging schedule, tariff assumptions, warranty compliance and the raw dispatch results.
Recent Posts
Switchgear Lead Times in 2026: A Buyer’s Planning Guide
Switchgear Lead Times in 2026: A Buyer’s Planning Guide Realistic timelines vary significantly by voltage class and type — here’s how to plan procurement without
What Is BESS? A Guide to Battery Energy Storage Systems for C&I Buyers
What Is BESS? A Guide to Battery Energy Storage Systems for C&I Buyers A clear explainer on what BESS systems actually are, how the pieces
Switchgear vs Transformer Lead Times: What EPC Contractors Need to Know
Switchgear vs Transformer Lead Times: What EPC Contractors Need to Know A practical breakdown of why these two equipment categories behave differently in procurement, and