Infrared Thermography Data Center Commissioning: What to Specify, When to Scan and What It Catches
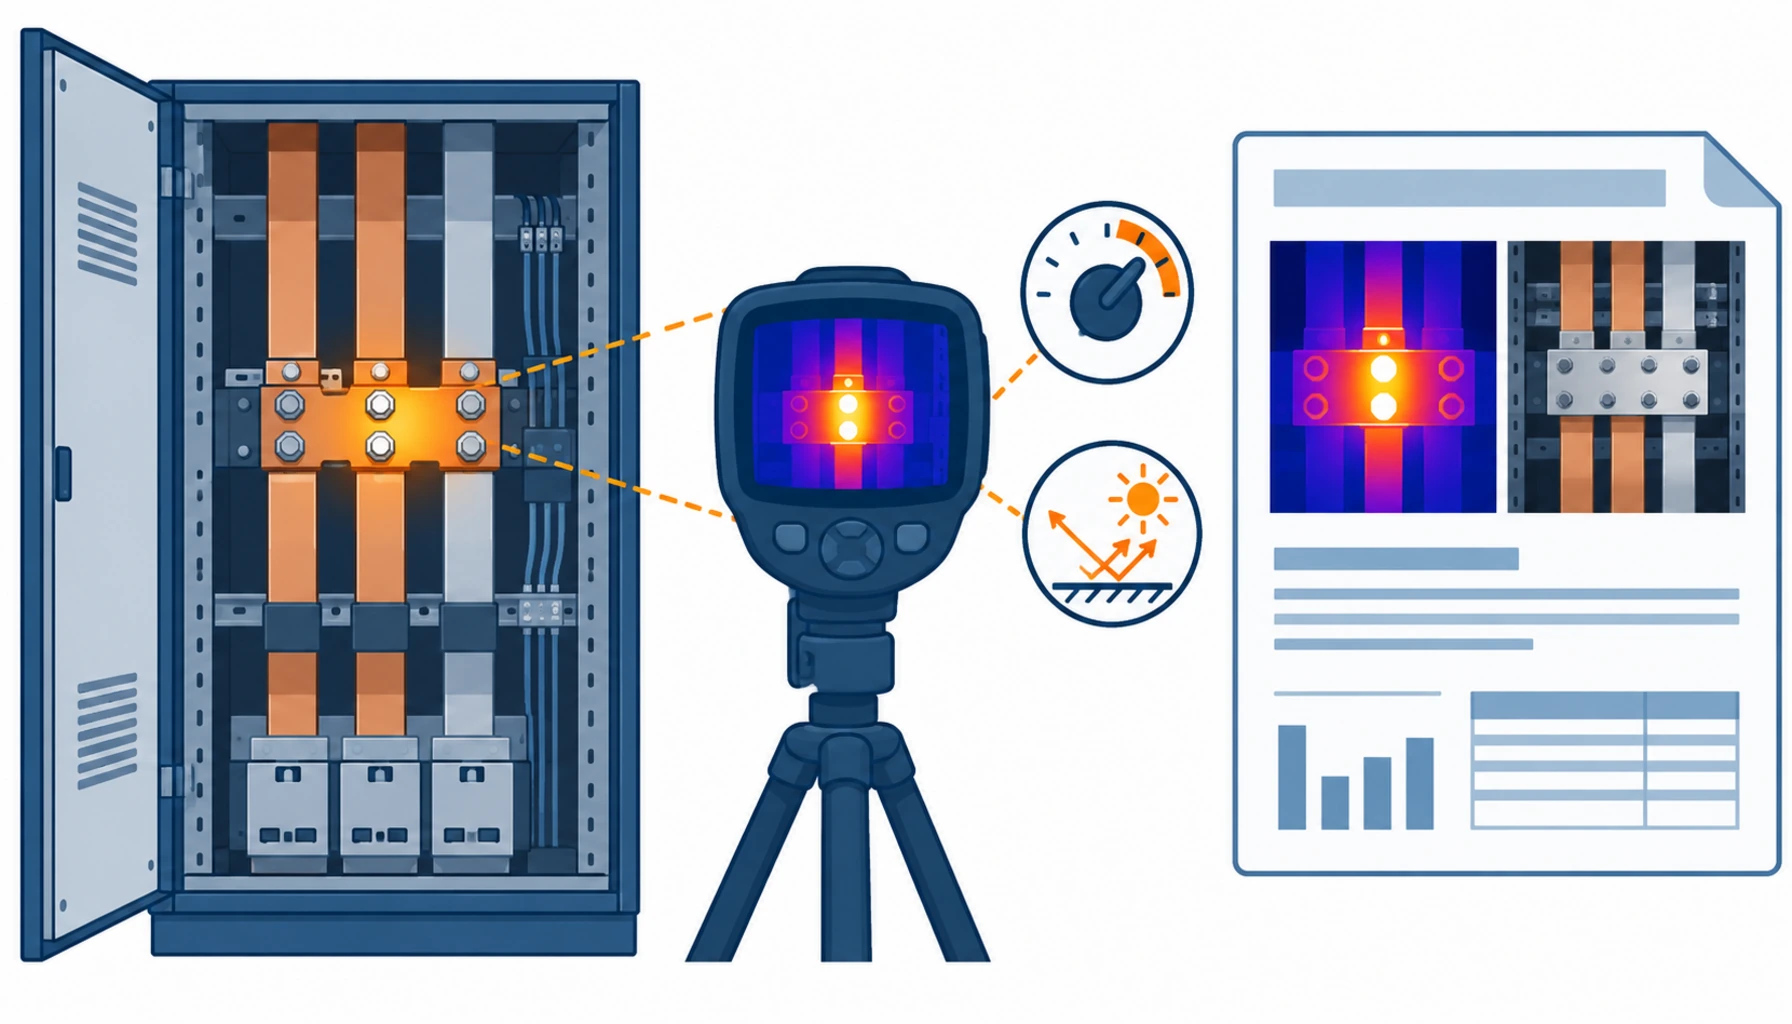
Quick Answer: A thermographic scan costs very little and returns almost nothing unless three conditions are met: the circuit is carrying meaningful load, the emissivity setting on the camera matches the surface being viewed, and the report identifies each anomaly with the load, the ambient conditions and both a thermal and a visible image. That makes thermography a specification purchase rather than an inspection purchase. Ask for those three and a certified thermographer, and the scan becomes the most cost-effective check available on a new distribution system. Leave them open and you will buy a page of colourful screenshots that no one can act on.
Thermography occupies an odd position in a commissioning programme. It is cheap, it is quick, it is non-contact, and it detects a class of defect that the electrical tests are blind to. A termination that was tightened to the wrong torque, a busbar joint with a damaged contact surface, a cable lug with only part of its strands engaged: none of these will fail an insulation resistance test on the day, and all of them show up as heat once current flows. That is the whole argument for scanning, and it is the reason the scan has to happen after energisation rather than before.
Introduction
The most common way a data center project wastes money on thermography is by booking the scan at the wrong point in the programme. The scan is usually arranged after practical completion, when the hall is tidy, the covers are on, and the loads have not been connected yet. Under those conditions a thermal camera shows a distribution board at ambient temperature, which is exactly what a perfectly installed board looks like. The report is clean, the budget line is closed, and the defects are still there.
The second most common way is to accept a report that cannot be acted on. A thermal image on its own tells you almost nothing about severity, because severity is defined by the temperature difference between a suspect connection and a comparable one under the same load. Without the load recorded, without the reference point named, and without a visible-light image of the same location, a maintenance team cannot decide whether to schedule a repair or monitor it. What a report should contain is therefore a contract question, not a preference. The electrical tests that run alongside the scan are covered in our note on insulation resistance and continuity testing, and the certification context is set out under TIA-942 certification testing.
What the Scan Actually Catches, and What It Does Not
It is worth being precise about the scope, because it decides what to put in the enquiry.
What it catches. High-resistance connections of every kind: a lug torqued below specification, a joint with an oxide layer, a busbar tap-off with a partially engaged contact, a fuse carrier with a poor spring, a cable termination with a damaged mating surface. It also catches imbalance between phases, which is often an installation error rather than a load condition. Because the mechanism is resistive heating, the defect develops gradually and the temperature difference is roughly proportional to the energy dissipated at the bad contact.
What it does not catch. Anything that does not generate heat at the moment of the scan. Insulation defects that have not broken down, mechanical damage inside a cable, an earthing path with high impedance but no current, a control circuit fault, moisture ingress before it causes tracking. Thermography complements the electrical tests rather than replacing any of them, and a specification that treats the scan as a substitute for insulation resistance measurement or continuity testing has removed a check rather than added one. Earthing verification in particular is a separate exercise, and it is covered in our note on grounding and bonding verification.
Emissivity: The Setting That Decides Whether the Scan Is Real
The single most important technical condition is also the one most often omitted from an enquiry.
A thermal camera calculates temperature from radiated energy, and the conversion depends on the emissivity of the surface being viewed. Bare copper and bright aluminium have low emissivity, which is a technical way of saying they reflect much of what falls on them rather than radiating their own heat predictably. Point a camera at a bright copper busbar with a default emissivity setting and the reading can be several tens of degrees away from the truth, in either direction. The consequences run both ways: a genuinely hot joint reads cool, and a cool joint in a reflective enclosure reads hot because it is reflecting a nearby warm surface.
Three countermeasures are available, and the enquiry should name which one applies.
Correct the setting. The thermographer sets the emissivity for the material and finish being viewed, and records the value used. This works and it requires the thermographer to know what the surface is, which brings us back to the visible-light image: without it, nobody can verify the setting afterwards.
Change the surface. Applying a high-emissivity target, a matte tape or a coating to the point being measured removes the uncertainty entirely. In practice this is done on critical joints during installation, and the cost is trivial.
Account for reflection. The reflected background temperature has to be measured and entered, and reflective enclosures have to be viewed from an angle that avoids mirroring other hot components. This is a technique question and it is why certification is worth paying for.
The commercial point is simple. Emissivity error does not produce an obviously bad report; it produces a plausible one. That is why the report has to state the emissivity and reflected temperature used at each anomaly, and why a buyer should treat their absence as evidence that the numbers were not meaningful.
The Decision Table: Scanning Options Compared
The table compares how a project can buy a thermal survey. The last two columns are the commercial ones: what the option costs and what it produces when it goes wrong.
| Option | What to Specify | Evidence You Receive | Cost and Timing Shape | Failure Mode If Chosen Wrong |
|---|---|---|---|---|
| In-house scan by operations | Camera specification, the operator's training, and the load condition at scan time | Images with limited reporting; useful for trends rather than acceptance | Lowest cost, easiest to repeat, available whenever the hall is loaded | A scan at low load that finds nothing and is recorded as a pass |
| Contractor scan as part of handover | Scope, timing relative to energisation, and the minimum load required | A report of variable quality, often without emissivity or load records | Low cost, bundled into the works, minimal leverage to improve it | A clean report issued before the circuits were loaded, valued as a compliance document |
| Certified thermographer, defined report | Personnel certification level, report content, and the severity criteria to be applied | Anomalies with thermal and visible images, load, emissivity and ambient records | Moderate cost, needs booking around energisation and load build-up | Certification without a report specification gives good images and unusable findings |
| Staged scans with load simulation | The stages, the load applied at each, and which circuits are covered in which stage | A per-stage record set that can be compared as load increases | Highest cost, best defect detection, needs load bank or real load available | Skipping the staged approach because the hall is not yet loaded, and losing detection entirely |
| Fixed online thermal monitoring | Which joints are monitored, alarm thresholds, and who responds to an alarm | Continuous trend data rather than point-in-time images | Capital cost plus integration; worth it only on the highest current joints | Monitoring installed with no alarm response plan, which is a dashboard rather than a control |
Load, Timing and Access: The Three Conditions Nobody Records
Severity in thermography is measured as a temperature difference, and a temperature difference only exists when current flows. That single fact drives the whole timing question.
Load. The industry severity guidance assumes the equipment is carrying a substantial fraction of its rated current, because at light load even a badly made joint stays close to ambient. The enquiry should state the minimum load that must be present for the scan to be considered valid, and the report should record the actual load on each circuit at the moment of scanning. Where a circuit cannot be loaded during the scan window, the honest position is that it has not been scanned, and it should be listed as such rather than implied as passed.
Timing. Scanning before the ceiling closes and before covers are fitted is the difference between a survey of the whole distribution system and a survey of the fronts of the switchboards. Access is a scheduling cost, not a material cost. On a new build the scan window is short and it competes with the trades that want to close up the building, which is exactly why it needs to be a dated deliverable rather than an activity that happens when convenient.
Steady state. Resistive heating takes time to reach a stable temperature, so scanning immediately after a load change produces readings that mean nothing. The practical requirement is a defined stabilisation period after the load reaches its scan condition, and a record of how long the circuit had been at that load before the image was taken.
Two of the three internal links in a typical anomaly report are therefore about context rather than temperature. That is not an accident: a temperature difference without a recorded load and a stabilisation time is a number that cannot be used to decide anything.
Building a Baseline Instead of Buying a One-Off Report
A thermal survey done once is a snapshot. Done repeatedly, to the same scope and the same severity criteria, it becomes a condition monitoring record, and that is where most of its value is.
The reason is that connections degrade gradually. A joint at five degrees above its neighbours today may be at fifteen degrees in two years, and the trend is what tells you when to intervene. Catching that trend requires the second scan to be comparable to the first, which means the same camera settings, the same emissivity values, the same viewing angles and the same load condition, all recorded. A report that consists of unlabelled screenshots in a slide deck cannot be compared to anything.
The practical procurement measures are modest. Ask for the anomaly list in tabular form as well as images, keyed to a location reference that matches the asset register. Ask for the emissivity and reflected temperature values used. Ask for the load on the circuit at the time. Then next year, the same table is filled in and the comparison is a spreadsheet exercise. On a hall where a loose connection at a high-current joint is a fire risk and an outage risk at the same time, a comparable baseline is worth more than a more detailed one-off study. The commissioning records that surround these surveys, and what an auditor will expect to find in them, are set out in our data center cabling checklist for EPC projects.
What to Freeze Before Booking the Scan
| Item | What to State | Evidence to Attach | Cost of Leaving It Open |
|---|---|---|---|
| Minimum scan load | The load each circuit must be carrying for the scan to be valid, as a percentage or an absolute value | Load recorded per circuit at the time of each image | A clean report produced at 10 percent load, and a defect that surfaces in service |
| Thermographer certification | The certification level required and that it is current | Certificate naming the level and the holder | Technique errors that produce plausible numbers, with no recourse |
| Emissivity and reflected temperature | That both values are set per surface, recorded, and reported with each anomaly | Report fields showing the values used | Readings tens of degrees out, in both directions, and no way to detect it afterwards |
| Visible-light image pairing | That every anomaly is documented with a matching visible image from the same position | Paired image set indexed to the asset reference | Findings that cannot be located on site without opening every enclosure |
| Severity criteria | The scheme used to classify findings, and the action each class triggers | Report applying the named scheme, with reference and suspect points identified | Findings graded by impression, and repairs scheduled on the wrong priority |
| Access and covers | Which covers are removed, when, and who reinstates them | Access schedule agreed with the electrical contractor | A survey of the outside of switchboards, described as a survey of the installation |
| Stabilisation period | How long the circuit is at scan load before imaging, and how that is confirmed | Time and load noted per image | Images taken during a load transient, and a false clean result |
| Baseline format | Tabular anomaly list keyed to the asset register, delivered in editable form | Spreadsheet plus image set, handed over with the commissioning records | A one-off report that cannot be compared to the next survey |
When Thermography Is Not the Answer
Thermal scanning is cheap enough that it is rarely a mistake to do it. It is a mistake to rely on it.
When the circuit cannot be loaded in the scan window. A scan at light load is close to worthless, and presenting it as an acceptance record is worse than not scanning, because it creates the impression of coverage. If the load is not available, either bring load simulation to the circuit or list it as unscanned.
When the cover cannot be opened. Sealed enclosures and flameproof equipment cannot be surveyed from outside with useful results. Here the alternative is embedded temperature monitoring or an inspection regime that opens the equipment on a schedule.
When the defect class is outside its reach. Insulation defects, water ingress before tracking, earthing impedance and control circuit faults do not produce the thermal signature a scan looks for. A project that substitutes a thermal survey for insulation testing, continuity checks and earth loop measurement has removed three tests and added one.
When nobody will act on the findings. The output of a scan is a repair list. If the project has no budget line for connection remediation and no procedure for scheduling it, the scan produces a document rather than an improvement. Budget the remediation at the same time as the survey, and expect it to be a small percentage of the electrical package rather than zero. The condition of the connections themselves is set out in our note on cabling a 1 MW rack, where joint quality has the largest effect.
RFQ Checklist
- Scan scope: which boards, joints, tap-offs and terminations, listed rather than described
- Minimum load condition per circuit for a valid scan, and how the load will be verified
- Thermographer certification level, current, with the certificate supplied
- Camera specification including thermal sensitivity and the ability to record emissivity per image
- Emissivity and reflected background temperature recorded and reported for every anomaly
- Severity scheme named, with the reference point and suspect point identified per finding
- Paired visible-light image for every anomaly, from the same position
- Access arrangements: covers removed, reinstated, and by whom
- Stabilisation period required before imaging, recorded per circuit
- Report in editable tabular form, keyed to the asset register and the location numbering
- Remediation budget and repair procedure agreed before the findings arrive
- First scan designated as the baseline, with the format for future comparisons fixed now
Conclusion
Thermography earns its place on a data center commissioning programme because it finds the class of defect that electrical tests miss, and it does so at a cost that is trivial next to the equipment it examines. The purchase that works names the load condition, the certification of the person holding the camera, the emissivity and reflected temperature settings, and the severity scheme. Add a paired image for every finding and an editable anomaly list, and the first scan becomes the baseline for every scan that follows.
Kexingyu Cable Group (KXYE) supplies the connections that these scans examine, from the busbar tap-off box and GGD power distribution cabinet end of the distribution system through the WDZ-YJY, WDZN-YJY, BTTZ, BBTRZ, NG-A (BTLY), KVV and YJV cable ranges, all from one factory group with copper price linkage available on project-scale orders. Every termination point ships with the torque and surface details a thermographic survey needs in order to interpret what it sees. Send your distribution schedule and the load condition you expect at commissioning, and we will return the equipment and cable data that supports it; the fastest route is a request for quotation.