Labor Shortages as a Demand Engine: Why Automation Spending Keeps Rising
Quick Answer: Labour scarcity, demographic and structural, is the quiet engine behind automation’s rise from a market of about USD 275 billion in 2025 toward USD 435 billion by 2030, and every point of that growth bends cable.
Most automation articles start with the robots. This one starts with the empty chairs. Across the manufacturing economies, the pattern repeats: vacancies in production roles that stay open for months, workforces ageing faster than apprentices arrive, and factory jobs that a generation of school leavers does not want at any wage the business model can carry. Labour scarcity of this kind is not a temporary post-pandemic hiccup, it is a demographic and structural fact, and it converts into automation spending with remarkable reliability. Market research consensus places the factory automation market around USD 275 billion in 2025, on a path toward roughly USD 435 billion by 2030, and the demand behind those figures traces back to the same root: there are not enough hands, and there will be fewer.
Introduction
The robot statistics tell the spending side of the story. IFR’s World Robotics 2026 records roughly 600,000 industrial robots installed worldwide in 2025, on an operating stock that has doubled in seven years to about 5 million machines, with a forecast of continued growth through the decade. Those machines exist because their economics improved at exactly the moment labour economics worsened: robot prices and capability curves bent downward while the supply of willing hands bent the other way. The crossing of those two curves is the demand engine this article examines, along with its consequences for the component markets, cable above all, that automation spending pulls behind it.
The framing matters for anyone who sells into this wave. Automation demand built on labour scarcity is different from demand built on fashion: it does not evaporate when sentiment turns, because the underlying scarcity persists. Understanding why makes the market’s trajectory legible, and the component demand that follows it predictable in structure even when it wobbles year to year.
Why the Shortage Is Structural, Not Cyclical
Three forces make manufacturing labour scarcity durable. Demographics is the first: the workforces of China, Japan, Korea, Germany and increasingly the Americas are ageing on schedules nobody can negotiate with, and each retiring machine operator takes experience the replacement market cannot supply. Structural preference is the second: across economies, young workers sort away from repetitive industrial work toward services, and no realistic wage closes that gap in industries whose margins are set by global competition. And the third is the skills mismatch: modern production needs technicians who can maintain automation rather than feed it, and the education pipeline for those technicians is slow to build everywhere at once.
Each force converts into robots through a different door. Demographics pushes capacity investment in ageing industrial economies; preference pushes process improvement in every economy at once; the skills mismatch pushes automation precisely because a machine arrives with its consistency included, while a new hire does not. The result is demand that spans rich and middle-income economies simultaneously, which is why global installations keep setting records even when any single economy softens. The competitive response inside manufacturing, from factory floors to the electrical rooms that feed them, follows the planning logic in the industrial power distribution checklist.
From Labour Arithmetic to Cable Demand
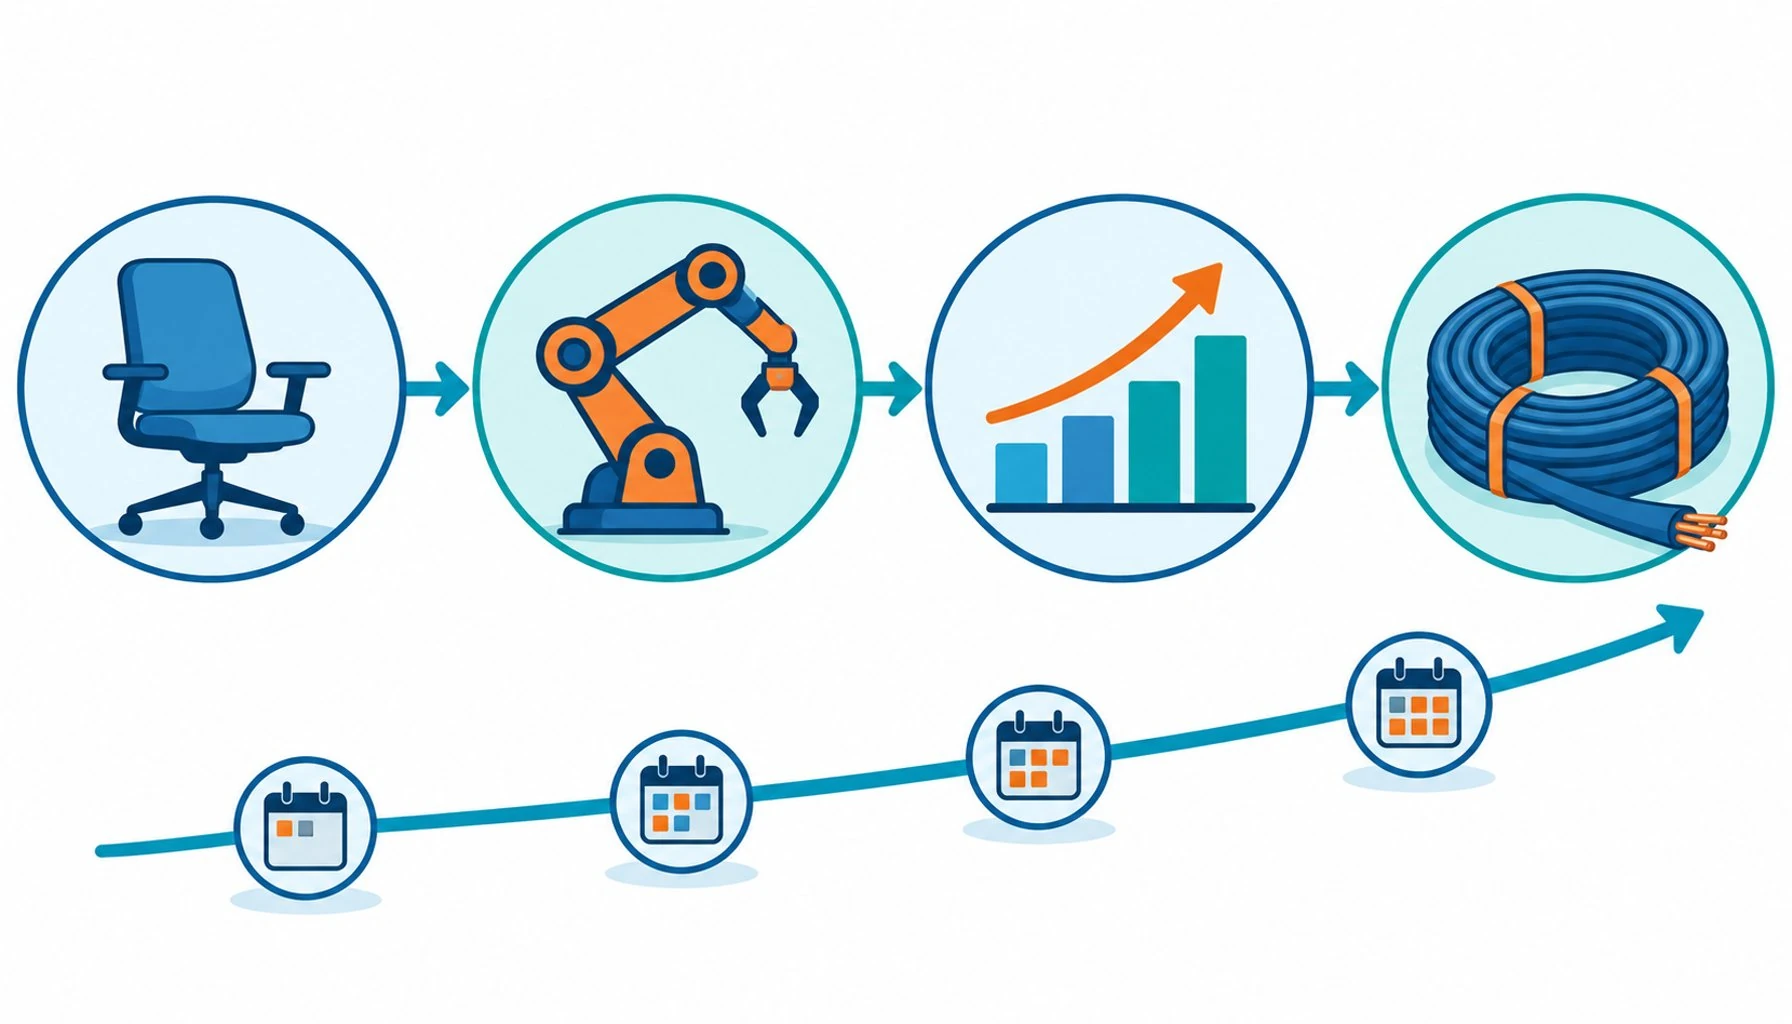
The chain from empty chairs to cable orders has four links. Labour scarcity drives automation investment; automation investment drives machine building; machine building drives component demand; and motion components, cable chief among them, wear and get replaced on schedules the machines themselves set. Market research sizes the market that results: the factory automation spend heading from about USD 275 billion toward USD 435 billion by 2030 carries with it a robot drag chain cable segment that QYResearch projects growing from roughly USD 850 million in 2026 to USD 1.24 billion by 2032, a smaller number with the same growth DNA.
The replacement layer deserves its own emphasis, because it is the part of the demand engine that most buyers miss. Every robot installed this year becomes a future cable customer, and every cable consumed creates its own successor demand. PW Consulting’s 2026 projections for the high-flex and warehouse segments, and the installation records in IFR’s World Robotics 2026, describe a compounding machine: fleets grow, fleets age, and the wear parts beneath them turn over on physics schedules that no recession fully cancels. Suppliers who understand this structure build for the long tail rather than the headline year, and the sourcing discipline that wins those positions is described in the checklist for evaluating a Chinese cable manufacturer.
| Link in the chain | What drives it | Evidence | Cable consequence |
|---|---|---|---|
| Labour scarcity | Demographics, preference, skills mismatch | Persistent vacancies across manufacturing economies | Demand that survives sentiment cycles |
| Automation investment | Robot economics crossed labour economics | 600,000 installations in 2025; stock doubled in 7 years (IFR 2026) | New machine builds consume flex cable |
| Market expansion | Investment compounding across economies | ~USD 275B toward USD 435B by 2030 | Demand spreads across industries, not one |
| Replacement cycles | Motion components wear on physics schedules | Drag chain cable ~USD 0.85B to 1.24B by 2032 (QYResearch) | Installed base becomes a recurring annuity |
What the Trajectory Means for Buyers and Suppliers
The table’s last row is the strategic one. Replacement demand behaves differently from new-build demand: it is less cyclical, more specification-driven, and won through construction stability and documentation rather than headline pricing. A cable supplier positioned for the replacement wave, with consistent constructions, traceable batches and the evidence culture that buyers verify, inherits demand that the machine builders have already educated. That is the quiet logic behind the industry’s steady consolidation toward suppliers who can prove what they ship, and the control and signal layer of that proof follows the disciplines in the guide to control versus instrumentation cabling.
When the Macro Story Is Not the Answer
For machine builders and integrators, the trajectory argues for locking component supply early: the cable constructions their machines depend on will face rising demand from every direction, and the suppliers who hold quality and capacity through the ramp will be the ones still answering RFQs in the busy years. For cable buyers, it argues for specification discipline over price discipline: in a market pulling upward, the cheapest quote is increasingly the one with the thinnest evidence behind it, and the cost of that difference lands on the maintenance calendar. For suppliers, it argues for capacity with a conscience, growing production without letting construction consistency slip, because the market’s growth is a test of reliability as much as volume.
It also argues for humility about timing. Labour-driven demand is durable but not smooth; investment waves arrive with project cycles, sentiment and credit, and the market’s upward line is drawn through years that dip. The demand engine, in other words, is real, but it delivers its growth unevenly, and the suppliers who endure are those who treat the dips as qualification seasons rather than emergencies. The electrical environment that automation investment builds out, from variable speed drives to the drives’ cabling, follows the technical comparisons in the guide to VFDs versus soft starters, and the failure science that keeps the installed base running is collected in the analysis of why cables fail on machines.
| Position | Why it fits the trajectory | Practical handling |
|---|---|---|
| Build for the replacement tail | Every installation becomes recurring demand | Hold constructions stable; keep batch records re-issuable |
| Specification over price | Rising demand amplifies the cost of thin evidence | Buy and sell on test data mapped to real duty |
| Capacity with consistency | The ramp tests reliability, not just volume | Grow production under change control, never around it |
| Qualify through the dips | Labour-driven demand is durable but uneven | Use slow years for qualifications and documentation depth |
| Serve the whole chain | Demand spreads across industries and duties | Maintain a portfolio from robot cells to warehouse and port duty |
RFQ Checklist: Positioning Cable in a Growth Decade
Three cautions close the batch. First, macro curves do not place orders; a supplier’s order book is built from named customers with named machines, and the market chart is context, not strategy. Second, labour scarcity does not make every automation project wise; cells are still specified by duty, and the cable in them is still chosen by the physics of the motion, not the sentiment of the decade. Third, the numbers in this article come from market research and industry reporting of varying rigour, and the honest use of them is directional: the direction, upward and compounding, is well supported; the decimals are not. The engineering discipline this catalogue exists to serve, matching cable to duty with evidence, remains the part of the market that does not trend.
Conclusion
Send these whether you build machines, run plants or supply both:
- The machine class and its duty profile, specified before price is discussed
- Cycle counts and duty hours at the real application, peak seasons stated
- Test evidence requested: flex life at radius, environmental and electrical data
- Construction stability terms: change control, batch traceability, record retention
- Replacement planning: spares, call-off terms and refit documentation
- Capacity expectations across the project or fleet ramp
- Standards and certificates matched to the destination market
- A supplier conversation that includes the slow years, not just the first order