
How to Size a UPS System for a Data Center
Sizing is the difference between a UPS that spends its life serving load and one that spends it in bypass, in overload, or in idleness—the method matters more than the number
Introduction
Ask for a UPS quotation without a load calculation and you will receive a price for the wrong machine. Too small, and the system lives in overload, transferring to bypass on every peak—the protection quietly cancelled. Too large, and the unit idles for years at light load where double-conversion efficiency is at its worst, wasting energy every hour while the capital sits idle in oversized modules. Between those failures sits a sizing method that any competent buyer can run, and it starts with counting loads, not browsing catalogs.
Data center sizing has a reputation for complexity because it touches everything: IT roadmaps, cooling strategy, redundancy philosophy, battery technology and the electrical grid itself. The method below keeps the complexity ordered rather than pretending it away—inventory, demand, units, margin, runtime—each step producing a number the next step consumes. Run it honestly and the resulting kW rating is defensible in front of any engineer or auditor.
This guide walks the method end to end, with a worked example, the factors that most often change the answer, and a checklist for the RFQ. For the equipment the sizing feeds into, start from our data center power equipment range.
Start with a Load Inventory, Not a Catalog
The first artifact of a serious sizing exercise is a table of everything the UPS will carry—every rack group, every cooling pump and fan wired to the critical bus, every lighting circuit and security system that must ride through an outage. IT load is the anchor: nameplate per rack, rack count, and the realistic draw rather than the sticker. A “30 kW” rack running virtualized enterprise load often draws 60–70% of nameplate; an AI training rack with dense GPU nodes can sit at 90% or higher. The inventory should distinguish these personalities rather than applying one fudge factor to the floor.
The same discipline applies to the non-IT load. Mechanical cooling that shares the critical bus—pumps, CRAH fans, heat-rejection auxiliaries—must be inventoried with its motor ratings, because motor starting behavior is its own sizing event. Lighting, access control, monitoring and BMS loads are small but belong on the list; they are exactly the loads that keep a dark facility manageable during an outage. Finally, list the future load explicitly—phase two racks, planned expansion—as its own line, not as vague allowance buried in a percentage.
From Nameplates to Real Demand
A raw sum of nameplates overbuys by a wide margin, because not everything peaks at once. The two corrections are demand factor (how much of a group’s rating it actually draws) and diversity (the probability that group peaks coincide). Virtualized IT clusters typically show high coincidence—an outage puts every workload on the survivors—while test labs and development halls show wide diversity. Mechanical loads start in sequence or in stages, and the sizing event is usually the staged restart, not steady state.
The practical output is a design load: realistic coincident maximum draw at the bus, in kW, at a stated operating point. Record the assumptions beside each number—demand factors, diversity reasoning, staged restart logic—because these are the lines an reviewing engineer will challenge first, and they are also the first thing to revisit at the annual capacity review. A load inventory without recorded assumptions is a number without provenance; it cannot be audited, so it cannot be trusted.
kW, kVA and Power Factor: Getting the Units Right
The classic sizing error happens at the unit conversion. Loads exist in kilowatts—real power doing work. UPS ratings are headlined in kVA—apparent power the inverter must carry, the vector sum of real power and reactive current. The bridge is power factor: a 500 kVA UPS at 0.9 pf delivers 450 kW; the same frame at 0.8 pf delivers 400 kW. Modern double-conversion units advertise pf of 0.9–1.0, which makes the kW rating the primary comparison figure and kVA the secondary check.
The reverse check matters too: compare the load’s power factor against the UPS’s rated output pf. A load drawing heavily reactive current (large motor groups, some legacy equipment) consumes kVA capacity beyond its kW—so a 400 kW load at 0.75 pf needs 533 kVA of capacity regardless of the UPS’s kW headline. When reconciling quotations, convert every offer to kW at the load’s actual pf and compare there. Half of the “competing quotes” confusion in UPS procurement is two vendors quoting different units with equal confidence.
Growth Margin: Buy for Year One, Size for Year Five
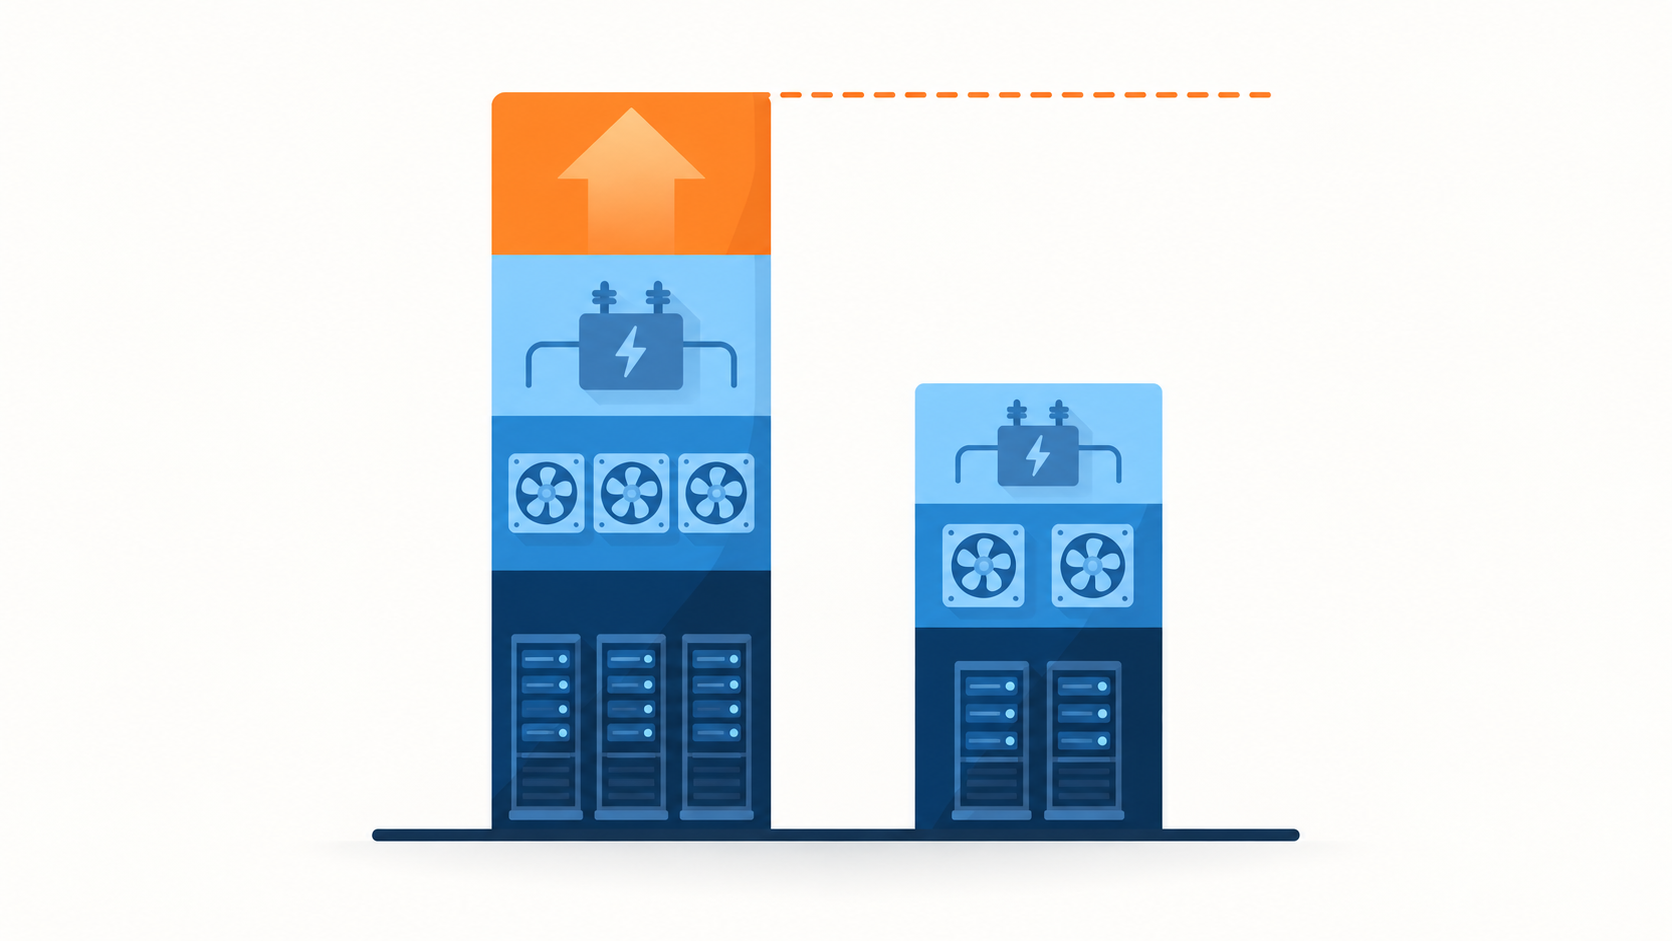
Data center loads grow—racks fill, densities rise, storage multiplies. The standard approach is layered margin: a working margin of 10–15% over today’s design load for measurement error and short-term drift, plus an explicit growth allowance for the 3–5 year horizon (commonly 20–25% of the initial IT load), plus the reserved future space as its own line. Sum them and you have the sizing rating; the capacity you actually commission on day one can be smaller—as long as the architecture allows the rest to be added without a forklift.
This is where architecture and sizing meet. The growth margin changes what you buy depending on the platform: a modular frame sized for the year-five figure with modules installed for year one; standalone units sized for today’s load with parallel capacity planned; or a hybrid where the upstream equipment carries the expansion. The margin logic is identical to upstream equipment sizing—our guide to transformer capacity sizing applies the same year-one-versus-year-five thinking one voltage level up. The groups that feed the calculation, and their typical guidance, are summarized below:
| Load Group | Typical Members | Demand Guidance | Margin Guidance |
|---|---|---|---|
| IT compute | Servers, storage, network fabric | 60â90% of nameplate depending on workload type; AI/HPC at the high end | +20â25% growth headroom for the 3â5 year horizon |
| Cooling (electrical) | CRAH fans, pumps, heat-rejection auxiliaries | Motor starting dominatesâsize for staged restart, not steady state | +15â20% starting margin; verify against UPS overload rating |
| Lighting and small power | LED circuits, receptacles, small auxiliaries | Stable and predictable | +10% working margin |
| Monitoring and security | BMS, access control, CCTV, alarms | Small, continuous, non-negotiable in outages | +10%; never traded away in value engineering |
| Future white space | Phase 2 racks, planned expansion | Zero today by definition | Carried as its own line; sized into frame/breakers now |
| Commissioning and test load | Temporary load banks during FAT/SAT | Full design load during testing | Verify overload capability covers it |
The Sizing Factors That Change the Answer
Beyond the load table, seven factors push the final number in one direction or another. The second and third most expensive sizing mistakes hide here:
| Factor | How It Moves the Sizing | The Common Mistake |
|---|---|---|
| Power factor (kW vs kVA) | Converts load kW into the kVA the inverter must carry | Matching nameplate kVA to a kW load without the pf bridge |
| Demand and diversity | Reduces the raw nameplate sum to a realistic coincident peak | Adding every nameplate at 100% with no diversity analysis |
| Growth margin | Adds explicit headroom for the expansion horizon | Sizing to today's load exactly; overloading in year two |
| Redundancy architecture | N+1 or 2N changes usable capacity per unit | Quoting total capacity and forgetting the redundant unit's share |
| Overload capability | Short-time overload absorbs motor starts and transients | Counting overload headroom as continuous capacity |
| Runtime requirement | Sets battery capacity, weight, room loading and cost | Sizing runtime to cover hours instead of the start-up bridge |
| Operating-point efficiency | Real losses depend on the load the unit actually carries | Comparing nameplate full-load efficiency across offers |
Runtime: Sizing the Battery, Not Just the UPS
UPS power electronics size for load; batteries size for time. The runtime window is a policy decision before it is a calculation: what must happen after the mains disappears? If the answer is “the generator starts and accepts load,” 5–10 minutes of runtime at design load covers the sequence with margin. If the answer is “the facility transfers to storage,” the UPS battery bridges the transfer event. If the answer is “nothing else exists,” you are sizing a BESS, not a UPS battery—our guide to BESS sizing picks up that problem, and the architecture question belongs in the same meeting.
Battery sizing then follows the runtime decision: discharge curves are non-linear, temperature and aging derate capacity, and the load’s end-of-discharge voltage matters. Chemistry choice—VRLA versus Li-ion—changes weight, footprint, monitoring depth and replacement cadence more than it changes the kW answer. Two sizing notes that catch teams out: batteries sized for a future larger load either sit undercharged at partial draw or get re-purchased with the expansion; and runtime quoted “at full load” shrinks dramatically at the partial loads of early operation, which is fine—provided the design point was honest.
Worked Example: Sizing for a 1 MW White Space
Consider a colocation hall with 1,000 kW of IT nameplate across 100 racks at 10 kW each, virtualized enterprise workloads running at about 65% of nameplate. Mechanical cooling sharing the critical bus adds 120 kW of pumps and fans; lighting, security and BMS add 30 kW. Diversity applied across the IT groups brings the coincident IT demand to roughly 700 kW; total present design load is therefore about 850 kW.
Apply the layered margin: +10% working margin and +20% growth allowance over IT brings the sizing rating to roughly 1,050 kW. At a UPS output power factor of 0.95, that is about 1,100 kVA of converter capacity. With N+1 redundancy, two 600 kW modular frames—each able to carry the day-one load with room for modules—or a parallel pair of standalone units with one redundant frame achieve the target. Batteries sized for 8 minutes at the design point bridge a generator start with margin. The exercise produces not just a number but a defensible trail: inventory, assumptions, margins and the architecture that absorbs them.
When the Answer Is Bigger Than One UPS
Above roughly 400–500 kW per frame, most designs move to parallel systems—and the sizing logic extends upward rather than restarting. Parallel units share load through synchronization controls; N+1 means one extra unit than the count required for the load; 2N means two fully independent systems each sized for everything. The sizing output should state which architecture it assumes, because “1.2 MW of UPS” means different hardware depending on whether it is N+1 modular or 2N standalone.
Plan the procurement timeline against real lead times. Large frames and their upstream switchgear share manufacturing queues; our review of the 2026 switchgear and transformer lead times describes the market’s current pace. A sizing exercise finished today should place its equipment orders within the same quarter—the load forecast will still be right when the hardware arrives; the manufacturing slot will not wait.
UPS Sizing Checklist for the RFQ
Before requesting quotations, make sure the package answers these:
- Load inventory: line-by-line kW with demand factors and assumptions recorded, present and future as separate lines.
- Design load: coincident peak in kW at stated power factor, with working margin and growth allowance shown separately.
- Architecture assumption: N, N+1 or 2N; modular or standalone; how the growth path is added later.
- Runtime policy: minutes at design load, the event the window covers, chemistry and monitoring depth.
- Mechanical restart plan: staged starting of pumps and fans, checked against UPS overload capability.
- Efficiency request: losses at 25/50/75/100% of actual expected operating load, not just nameplate.
- Upstream coordination: input current harmonics (THDi), generator compatibility, upstream breaker coordination.
- Test load: commissioning load-bank scope and whether witnessed FAT runs at the design point.
Conclusion
UPS sizing is a chain of small, honest numbers: a load inventory with recorded assumptions, a demand correction, a unit conversion done in the right direction, margins layered with dates on them, and a runtime window tied to a named event. Each link is simple; the discipline is refusing to skip one. Sized this way, the UPS rating survives contact with reality—growth, motor starts, the first hot summer, the second phase of racks.
Do the method once, document it, and revisit it annually; capacity planning is a habit, not a project. And when the sizing is ready to become a purchase, the team at KXY E-Power Group works from your load table directly—quoting the UPS together with the switchgear, transfer and storage around it so the whole power train sizes as one system.
Frequently Asked Questions
Recent Posts
Voltage Stabilizers vs UPS: Do You Need Both?
Voltage Stabilizers vs UPS: Do You Need Both? One device fixes how high or low the voltage is; the other fixes whether there is voltage
Energy Storage for Data Centers: A Growing Backup Power Option
Energy Storage for Data Centers: A Growing Backup Power Option Batteries have always backed up data centers in the form of UPS strings. Grid-scale BESS
Thermal Runaway in Lithium Batteries: What BESS Buyers Should Understand
Thermal Runaway in Lithium Batteries: What BESS Buyers Should Understand How thermal runaway starts, how it propagates, and which evidence buyers should require before approving